Our Competitive Advantages
Our unique assets, high degree of vertical integration and self-sufficiency in key feedstocks enable us to control costs and maintain stable margins, while providing opportunities for sustainable growth.
PhosAgro’s strategic goal of increasing production and sales flexibility played an important role in our strong 2012 financial results. Following our decision early in the year to focus on NPKs, we produced a total of 1.6 mln tonnes of complex NPK fertilizers in 2012, an increase of 37% compared to 2011. Our total NPK capacity on our fully flexible production lines is 1.8 mln tonnes.
In the course of 2012, we increased the number of NPK/NPS/PKS grades from 7 to 16. This is a continuation of a multi-year strategic initiative: during the four years from 2008, we increased the total number of downstream products we produce from 9 to 23.
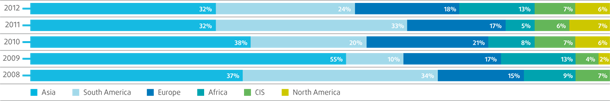
We were able to increase shipments to certain regions of Africa, Asia and Latin America where infrastructure constraints hamper bulkshipments
With demand for DAP/MAP under significant pressure for much of 2012, PhosAgro’s production flexibility and wide array of complex fertilizer grades enabled us to maintain full production capacity utilisation during the year while many phosphate-based fertilizer producers were forced to curtail production.
We also significantly increased NPS production in 2012, quickly responding to market demand for these products globally, especially in Europe, Latin America, South East Asia and Africa. NPS output in 2012 was 346 thousand tonnes, a more than four-fold increase from 82 thousand tonnes in 2011. For more information about NPS fertilizers, see the phosphate-based products segment in the 2012 operational review on Phosphate segment – Downstream.
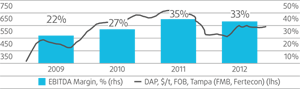
Flexible production capabilities... mln t

... make for resilient profit margins... USD
We control approximately 70% of the cash costs involved in DAP production.
PhosAgro is one of the few phosphate producers in the world that combines significant self-sufficiency in phosphate rock, ammonia and electricity with local availability of natural gas, sulphur and potash, which are key feedstocks for value-added phosphate-based fertilizer products. This means that we control approximately 70% of the cash costs involved in DAP production. This level of selfsufficiency allows us to benefit from greater stability of input costs, which means we benefit from higher margins at the top of cycles and can better protect our profitability during a decline.
Our competitive position is further enhanced by domestic access to key feedstocks: sulphur, natural gas and potash.
Self-sufficiency in key feedstocks helps us secure lower costs:
- 100% self-sufficient in phosphate rock;
- 72%-90% self-sufficient in ammonia;
- over 40% self-sufficiency in electricity.
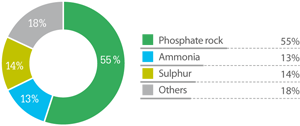
PhosAgro DAP production cash costs
The high quality and P₂O₅ content of our phosphate rock helps lower our cost of downstream processing.
We mine and process our apatite-nepheline ore at our subsidiary Apatit, where proven reserves and resources of apatite-nepheline ore (2,093 million tonnes) are sufficient for over 75 years of production at current extraction rates.
We produce high-grade phosphate rock (P₂O₅ content of over 39%), with very low radioactivity levels and minimal content of harmful materials like cadmium and lead. This unique, high-quality raw material enables us to significantly reduce costs for further processing of phosphate rock into finished products.
 Russia
 Morocco
 USA
USA Jordan
 China
China Tunisia
Source: Fertecon, IMC, USGS 2011.