Statement of Comprehensive Income
REVENUE
Our 2012 consolidated revenue was RUB 105,303 million, compared toRUB 100,518 million in 2011, largely as a result of higher sales volumes forboth phosphate-based and nitrogen fertilizers, especially complex NPKand NPS products. In 2012, our phosphate fertilizers segment contributed87% (FY11: 89%) of consolidated revenue, while the nitrogen fertilizerssegment accounting for 12% (FY11: 11%). Revenue from export salesaccounted for 69% of our consolidated revenue in 2012, compared to 70% in 2011.
Changes to the geographic structure of sales were largely driven by our decision to focus on production of complex NPK fertilizers due to stronger demand vs. MAP/DAP fertilizers, and the introduction of sales in containers in Q1 2012. Container sales were especially strong in areas where infrastructure limitations restrain bulk shipments.

Containers can hold upto 29 tonnes of fertilizers,and offer far greater logisticsflexibility than bulk vessels.We can load a container at ourproduction facilities, and it canthen be transported by rail,truck and/or ship to anywherein the world — which isespecially convenient for places where infrastructure contraints limitbulk cargo handling capabilities. This helped us significantly increaseour sales of NPK fertilizers to Africa and a number of Asian countries,including Thailand, China, Indonesia, Malaysia, the Philippines andSouth Korea. Netback prices for container sales are often higherthan for bulk sales due to lower shipping costs and the premium wecan charge for smaller volumes.
The geography of our complex NPK fertilizer sales by region is detailed on the inside front cover of this report.
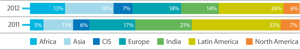
Our global sales flexibility, combined with our ability to quickly switch our production lines to meet demand, meant that the geography of our export sales changed significantly in 2012 compared to 2011. Revenue from Asia and Africa increased y-o-y by 42% and 151%, respectively, while sales to India declined by 38% because we focused on sales to regions where we could achieve better netback prices while India used its bargaining power to put downward pressure on the phosphatebased fertilizer market. Overall, revenue from export sales increased 3% to RUB 72,163 million in 2012, compared to RUB 70,263 million a year earlier.
Revenue by region RUB million
| 2012 | 2011 | % change | |
|---|---|---|---|
| North and Latin America | 24,380 | 28,287 | (14%) |
| Europe | 16,822 | 16,197 | 4% |
| Asia | 9,051 | 6,396 | 42% |
| Africa | 7,579 | 3,016 | 151% |
| India | 7,454 | 12,029 | (38%) |
| CIS | 6,877 | 4,338 | 59% |
| Total | 72,163 | 70,263 | 3% |
Segment revenue structure RUB million
| 2012 | 2011 | % change | |
|---|---|---|---|
| Phosphate-based products | 91,233 | 88,982 | 3% |
| Nitrogen fertilizers | 13,048 | 10,727 | 22% |
| Other operations | 1,022 | 809 | 26% |
| Total | 105,303 | 100,518 | 5% |
Breakdown of export revenue by region %

Phosphate-based products segment
Phosphate-based products segment RUB million
| 2012 | 2011 | % change | |
|---|---|---|---|
| Revenue | 91,233 | 88,982 | 3% |
| Cost of goods sold | (55,276) | (50,631) | 9% |
| Gross profit | 35,957 | 38,351 | (6%) |
Phosphate segment revenue increased by 3% y-o-y and totalled RUB 91,233 million in 2012. We increased production of phosphate-based fertilizers and MCP by 6% y-o-y, while sales volumes were up 4% y-o-y. Production and sales volumes for phosphate rock and nepheline concentrate increased in 2012 compared to 2011 by 3% and 10%, respectively.
Revenue from NPK fertilizer export sales increased 39% in 2012 to RUB 15,617 million from RUB 11,254 million as a result of a 48% increase in NPK export sales volumes. Revenue from NPS export sales increased over three-fold, mainly due to an identical increase in export volumes. Our record levels of NPK production and sales contributed to a 24% decline in export sales revenue for DAP/MAP to RUB 29,969 million in 2012 from RUB 39,594 million for 2011. Domestic MAP revenues increased 24% to RUB 3,887 million from RUB 3,138 million as a result of an 8% increase in revenue per tonne and a 15% increase in sales volumes. Revenue from phosphate rock increased 34% y-o-y in 2012, reaching RUB 19,452 million on higher revenue per tonne (up 19% y-o-y on domestic market and 8% on export market) and higher sales volumes (up 6% y-o-y on domestic market and 37% on export market).
Revenue per tonne for principal phosphatebased products in the domestic market ’000 RUB

Sales volumes of principal phosphate-based fertilizers and feed phosphates (MCP) kt

Revenue per tonne for principal phosphatebased products in export markets ’000 RUB

Breakdown of export sales volumes of phosphatebased fertilizers and feed phosphate (MCP) by region %
Segment CoGS and gross profit
We are largely self-sufficient in key raw materials for phosphate fertilizer production, and therefore not subject to price inflation for phosphate rock. Expenditure on potash, a key raw material for complex NPK fertilizers, increased 52% y-o-y in 2012, reaching RUB 4,598 million, due to a 21% y-o-y increase in volumes of potash purchased and a 26% increase in cost per tonne to RUB 8,202 from RUB 6,505. This was partially compensated for by a 26% y-o-y decline in expenditures on sulphur and sulphuric acid, to RUB 3,597 million in 2012 from RUB 4,838 million in 2011. Sulphur purchase prices declined by 25% to RUB 2,442 per tonne from RUB 3,271 per tonne, while volumes purchased decreased slightly (less than 1% y-o-y) in 2012. These factors, combined with a 4% increase in sales volumes of phosphate-based fertilizers, contributed to a 9% increase in cost of goods sold to RUB 55,276 million from RUB 50,631 million. The phosphate segment’s gross profit for 2012 decreased by 6% to RUB 35,957 million from RUB 38,351 million, resulting in a 2012 gross profit margin of 39%, compared to 43% in 2011.
Nitrogen fertilizers segment
Nitrogen fertilizers segment RUB million
| 2012 | 2011 | % change | |
|---|---|---|---|
| Revenue | 13,048 | 10,727 | 22% |
| Inter-segment revenues | 3,175 | 3,629 | (13%) |
| Cost of goods sold | (7,632) | (7,495) | 2% |
| Gross profit | 8,591 | 6,861 | 25% |
Revenue in the nitrogen segment was RUB 13,048 million in 2012, an increase of 22% from RUB 10,727 million in 2011. Sales volumes of nitrogen fertilizers increased 23% y-o-y in 2012, primarily as a result of the ramp up and launch of the new urea production unit at PhosAgro- Cherepovets during the second half of 2012.
Urea revenue increased 68% y-o-y to RUB 8,394 million in 2012 from RUB 5,004 million a year earlier as a result of a 62% y-o-y increase in sales volumes and a 3% y-o-y increase in export prices. This was partially offset by a 26% y-o-y decrease in revenue from ammonium nitrate (AN) sales to RUB 2,837 million from RUB 3,822 million due to lower production volumes.
Segment CoGS and gross profit
The price of natural gas, which is the key raw material for nitrogen fertilizers, increased in 2012 as Gazprom continued its policy of moving towards liberalizing domestic gas prices. Since 1 July 2012, gas tariffs for Russian industrial consumers increased by 15%. PhosAgro’s average natural gas purchase price increased by 8% from RUB 3,015 per th. m³ (RUB 89 per mmBtu) in 2011 to RUB 3,248 roubles per th. m³ (RUB 97 per mmBtu) in 2012.
As a result, nitrogen segment gross profit increased by 25% y-o-y to RUB 8,591 million in 2012, with a gross profit margin of 53%.
Revenue per tonne for principal fertilizer in the domestic market ’000 RUB

Revenue per tonne for principal fertilizers in the export market ’000 RUB

Sales volumes of principal nitrogen fertilizers kt

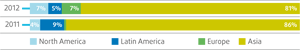
Breakdown of export sales volumes of nitrogen fertilizers by region %
Cost of Sales
Cost of goods sold rose by 7% y-o-y in 2012 to RUB 60,136 million from RUB 56,196 million. This was in line with the 8% increase in fertilizer sales volumes.
Structure of cost of goods sold
| 2012 | 2011 | Change y-o-y | ||||
|---|---|---|---|---|---|---|
| RUB million | % of cost of sales | RUB million | % of cost of sales | RUB mln | % | |
| Materials and services | 21,792 | 36% | 20,006 | 36% | 1,786 | 9% |
| Salaries and social contributions | 11,963 | 20% | 11,078 | 20% | 885 | 8% |
| Potash | 4,598 | 8% | 3,026 | 5% | 1,572 | 52% |
| Natural gas | 5,733 | 9% | 4,951 | 9% | 782 | 16% |
| Depreciation | 5,936 | 10% | 5,486 | 10% | 450 | 8% |
| Fuel | 4,579 | 8% | 4,207 | 7% | 372 | 9% |
| Sulphur and sulphuric acid | 3,597 | 6% | 4,838 | 9% | (1,241) | (26%) |
| Electricity | 3,255 | 5% | 3,290 | 6% | (35) | (1%) |
| Other items | 88 | 0% | 51 | 0% | 37 | 73% |
| Change in stock of WIP and finished goods | (1,405) | (2%) | (737) | (2%) | (668) | 91% |
| Total | 60,136 | 100% | 56,196 | 100% | 3,940 | 7% |
The increase in cost of sales was primarily due to the following changes in 2012 compared to 2011:
- A 9% increase in materials and services costs due to higher fertilizer sales volumes and inflation (Russian PPI of 5% for 2012) to RUB 21,792 million from RUB 20,006 million;
- A 52% increase in expenditure on potash due to substantially higher NPK sales (up 39% y-o-y in volumes) as well as a 26% increase in potash cost per tonne to RUB 8,202 in 2012 from RUB 6,505 in 2011; and
- A 16% increase in expenditure on natural gas to RUB 5,733 million from RUB 4,951 million. This was due to an 8% increase in consumption of natural gas related to an 8% y-o-y increase in ammonia production and to the launch of a new 32 MW electricity generation unit at the Cherepovetsk nitrogen complex, as well as to an 8% y-o-y increase in the price of gas to RUB 3,248 per thousand cubic meters from RUB 3,015 in 2011.
Selling, General and Administrative Expenses
Administrative expenses rose by 10% y-o-y to RUB 6,646 million in 2012 from RUB 6,036 million, mainly due to an increase in salaries and social contributions of RUB 216 million, or 6%, primarily as a result of increases in salaries in line with CPI and continued pay-outs related to employee redundancy.
Selling expenses rose by 19% y-o-y to RUB 7,720 million in 2012 from RUB 6,492 million in 2011. The Russian Railways infrastructure tariff and operators’ fees increased by 10% y-o-y to RUB 3,825 million from RUB 3,488 million as a result of a 6% increase in the Russian Railways tariff and increased transportation volumes. Port and stevedoring expenses rose by 47% to RUB 2,309 million from RUB 1,571 million y-o-y, primarily due to a 9% increase in export sales volumes of PhosAgro’s end products and a substantial increase of CFR deliveries as a result of the introduction of container sales from the beginning of 2012.
Gross Profit, Operating Profit, EBITDA and Profit for the Period
Gross profit was up 2% y-o-y and totalled RUB 45,167 million in 2012 (FY 11: RUB 44,322 million) with gross margin decreasing slightly from 44% in 2011 to 43% in 2012.
Operating profit for 2012 declined 4% to RUB 28,174 million, compared to RUB 29,319 million in 2011. This decline was significantly lower than the 14% y-o-y decrease in the average price for the main phosphate fertilizer DAP in 2012, from USD 621 in 2011 to USD 535 (both FOB Tampa) in 2012. As a result, our operating margin decreased from 29% in 2011 to 27% or by just two percentage points. We calculate EBITDA based on operating profit, thus the 2% decline in EBITDA in 2012 to RUB 34,695 million (FY11: RUB 35,370 million) reflects the change in operating profit margin. Despite unfavourable market conditions we managed to achieve a solid EBITDA margin of 33%, compared to 35% in 2011. Our net profit for 2012 increased by 9% y-o-y and amounted to RUB 24,510 million, compared to RUB 22,476 million in 2011.
Rouble exchange rates experienced significant volatility in 2011 and 2012. The average RUB/USD rate for 2012 was 31.0930, an increase of 6% from the average for 2011 of 29.3874. We use foreign currencydenominated loans as a natural hedge against export sales that account for approximately 69% of revenue for 2012. While the weaker rouble increases export sales in rouble terms, we account for the foreign exchange rate gain or loss at the end of the period on foreign currency denominated loans. From 31 December 2011 the rouble appreciated against the USD from 32.1961 to 30.3727 as of 31 December 2012, resulting in an exchange rate gain of RUB 1,576 million compared with a loss of RUB 2,836 million recorded in 2011.