Downstream review
Our downstream operations consist of the production of phosphate-based fertilisers and feed grade monocalcium phosphate (MCP), as well as nitrogen-based fertilisers and ammonia. We are Europe’s leading and Russia’s only producer of feed monocalcium phosphate (MCP), and a top-5 global monoammonium and diammonium phosphates (MAP/DAP) producerFertecon.
Key Products
The product group of phosphate-based fertilisers include: monoammonium phosphate (MAP), diammonium phosphate (DAP), liquid ammonium polyphosphate (APP), nitrogen-phosphorus-potassium (NPK), nitrogen-phosphorus-sulphur (NPS) and feed grade monocalcium phosphate (MCP).
Ammonium nitrate (AN), AN-based fertilisers and urea belong to the nitrogen-based fertiliser product group.
Our Assets
Ammophos and BMF are PhosAgro’s key assets producing phosphate-based fertilisers and MCP. Both Ammophos and BMF produce MAP, DAP and NPS, whereas only Ammophos produces NPK and APP and only BMF produces MCP. Ammonia, ammonium nitrate and AN-based fertilisers are produced at Cherepovetsky Azot, while urea is produced at Agro-Cherepovets.
Ammophos |
Balakovo Mineral Fertilisers (BMF) |
Cherepovetsky Azot and Agro-Cherepovets |
|
Overview
|
Overview
|
Overview
|
|
Production Capacity:
|
Production Capacity:
|
Production Capacity
|
|
Phosphate rock processing capacity:
|
Phosphate rock processing capacity:
|
Performance in 2011
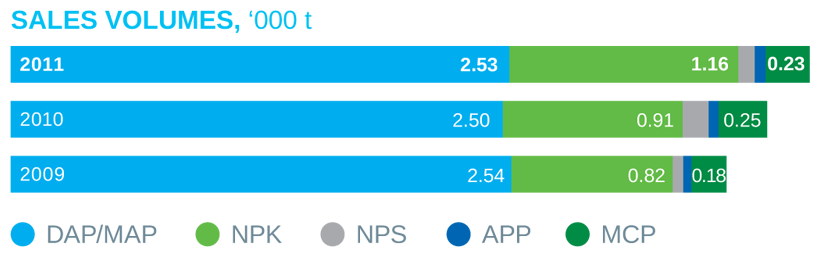
Phosphate-based fertilisers and feed phosphate groupThe total revenue from the phosphate-based product groupPhosphate-based fertilisers, feed phosphate (MCP) and apatite concentrate are included to the phosphate-based product group increased by 29% year-on-year and totalled RUB 88,982 million in 2011. Revenue from external sales of phosphate-based products accounted for 89% of PhosAgro’s external revenues in 2011, which is unchanged from the 2010 result. In 2011, the Company increased output of phosphate-based fertilisers and MCP by 6% year-on-year, while sales were also up 6% year-on-year. This increase is a result of PhosAgro delivering on its strategy to grow organically through increasing the processing of its own phosphate rock for phosphate-based fertilisers such as MAP, DAP and NPK. In 2011, in line with its flexible business model, PhosAgro switched its DAP production to NPK in order to meet changing market demand as well as to receive higher margins. Production and sales volumes of NPK were therefore respectively up 29% year-on-year and 27% year-on-year. Production and sales volumes of feed phosphate (MCP) decreased respectively by 7% year-on-year and by 8% year-on-year, largely due to unfavourable market conditions. The phosphate-based product group’s gross profit for 2011 was up 32% year-on-year to RUB 38,351 million, resulting in a gross profit margin of 43%, compared to 38% in 2010, mainly due to an increase in prices for phosphate-based fertilisers. PhosAgro is fully self-sufficient in phosphate rock, and is therefore not subject to price inflation for phosphate rock. As regards ammonia, which is used for phosphate-based fertilisers, PhosAgro is 92% self-sufficient. This enables PhosAgro to control approximately 65% of its DAP production costs. However, expenditure on sulphur and sulphuric acid, used primarily in the production of phosphate fertilisers, amounted to RUB 4,838 million in 2011, up 98% from RUB 2,447 million in the previous year. |
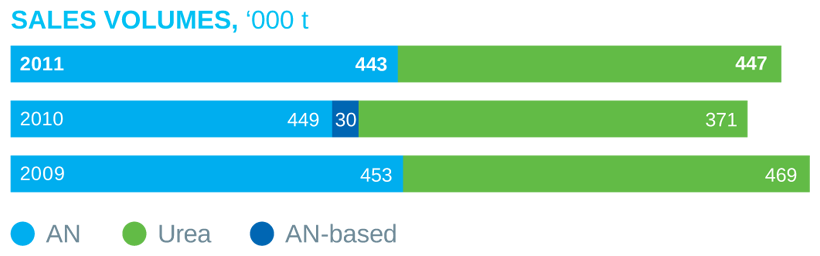
Nitrogen fertiliser groupRevenue in the nitrogen fertiliser group was RUB 10,727 million in 2011, an increase of 53% year-on-year, compared to RUB 7,012 million in 2010. Revenues from external sales accounted for 11% of PhosAgro’s external revenues in 2011, compared to 9% in 2010. The production of nitrogen fertilisers was up 2% year-on-year, with sales rising 5% year-on-year in 2011, mainly as a result of global demand for nitrogen fertilisers. Gross profit rose by 136% year-onyear to RUB 6,861 million in 2011 with a gross profit margin of 48%. In 2011, the price of natural gas, which is the main raw material for nitrogen fertiliser production, continued to increase in Russia. While still significantly below the price that European producers have to pay, the average natural gas purchase price paid by PhosAgro grew by 15% in 2011, and its costs related to natural gas increased by 11% in the same period. The comparatively smaller increase in PhosAgro’s total natural gas costs, compared to the change in price per thousand cubic metres, was due to the modernisation of the Cherepovetsk ammonia production line. As a result, gas consumption per tonne of ammonia decreased by 3% at Cherepovetsky Azot. | ||||||||||||||||||||||||||||||||||||||||||||||||||||||||||||||||||||||||
| PhosAgro’s revenue per tonne for the principal phosphate-based fertilisers and feed phosphate, RUB | PhosAgro’s revenue per tonne for the principal nitrogen fertilisers, RUB | ||||||||||||||||||||||||||||||||||||||||||||||||||||||||||||||||||||||||
|
| ||||||||||||||||||||||||||||||||||||||||||||||||||||||||||||||||||||||||
| Sales Volumes, ‘000 t | Sales Volumes, ‘000 t | ||||||||||||||||||||||||||||||||||||||||||||||||||||||||||||||||||||||||
 |
 | ||||||||||||||||||||||||||||||||||||||||||||||||||||||||||||||||||||||||
| Download XLS | Download XLS | ||||||||||||||||||||||||||||||||||||||||||||||||||||||||||||||||||||||||
| Export sales Volumes breakdown,, % | Export sales Volumes breakdown, % | ||||||||||||||||||||||||||||||||||||||||||||||||||||||||||||||||||||||||

Source: PhosAgro Download XLS |  Download XLS |